The Sustainable 60' Streets proposal was inspired by two “Drive Like You Live Here“ signs two families posted around the corner from me. I love that these families prioritize safety and are asking drivers to slow down. But such signs (and speed limit signs too) won't do much when the design speed of the street doesn’t match the desired speed. What do I mean by design speed? Consider these two photos.
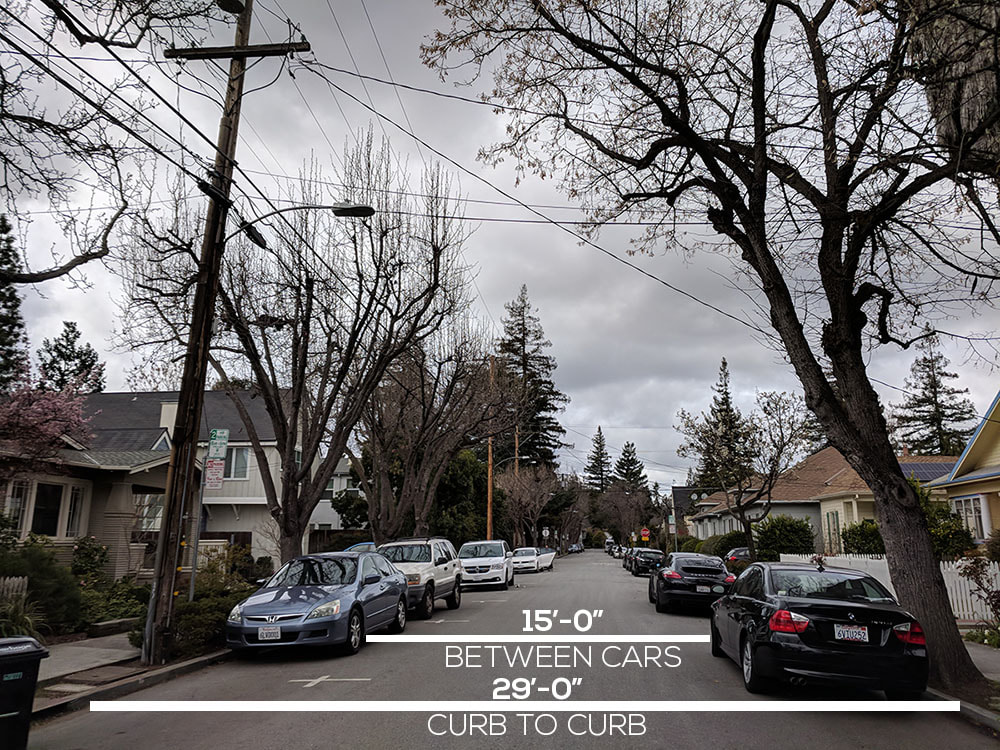 | 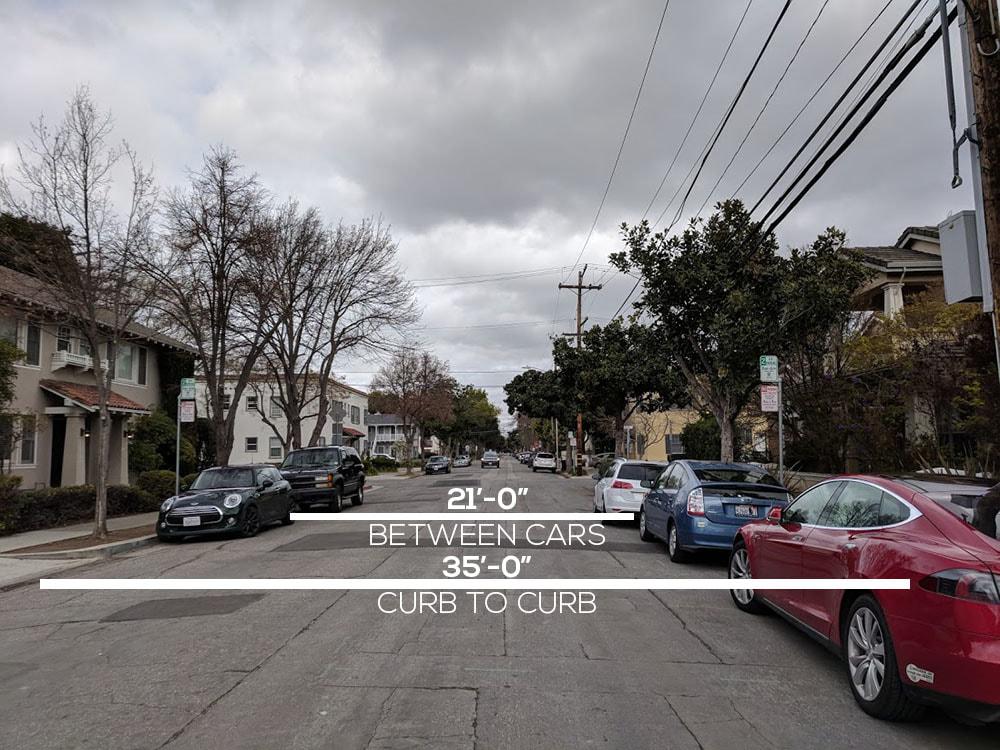 |
On the left is my own narrow street, about 29’ from curb to curb. On the right is my cross street, a more common street width, about 35’ from curb to curb. Both are typical residential streets and function as such. Both have posted speed limits of 25 mph. Both streets have parked cars on both sides. But because they have different widths, they inherently have different design speeds.
Which street do people tend to drive more quickly on? On my narrow street, drivers have to slow down and yield to each other when passing, because the effective space between the parked cars is only about 15’ between parked cars. On my cross street, it’s much easier for two way traffic to speed past each other comfortably because there is 21’ of effective space in between the parked cars. Given these different designs, which street has a higher accident rate?
Which street do people tend to drive more quickly on? On my narrow street, drivers have to slow down and yield to each other when passing, because the effective space between the parked cars is only about 15’ between parked cars. On my cross street, it’s much easier for two way traffic to speed past each other comfortably because there is 21’ of effective space in between the parked cars. Given these different designs, which street has a higher accident rate?
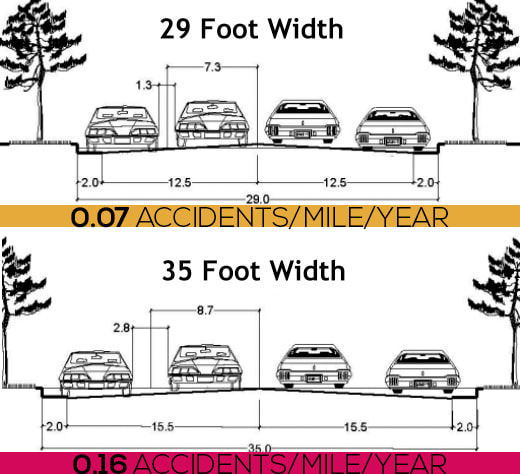
Several studies completed by Swift & Associates in 1997, 2002 and 2006 analyzed traffic accident data in Longmont, CO and showed that wider streets created conditions for people to drive faster, and had more accidents. On a 35’ road, the effective width of a single car lane is 10’. For an effective drive lane width of 10’, the 85th percentile speed that people drive is around 40 mph, 15 mph over the speed limit of a residential neighborhood! A pedestrian hit at 20mph has a 95% likelihood of surviving, at 30mph, the survival rate decreases to 55% but at 40mph, the survival rate plummets to only 5%. The 35' curb to curb width is dangerous by design.
If our residential roads are inherently dangerous and induce fast speeds, can we retrofit our existing streets so the design speed matches a neighborhood’s desired speed (20-25 mph)?
The Sustainable 60' Streets outlines five steps to transform the typical 60' street/36' curb-to-curb width with desired neighborhood street speeds, and improve bicycling as primary transportation. If we tried one step per year, in five years, we could change the design speeds for car travel on our streets, create an instant bike network, decrease the percentage of our streets dedicated to cars from 60% to 40%, and help reduce emissions and VMT!
It's 2018 now. Can we create a whole network of Sustainable 60' Streets by 2023?
 RSS Feed